
A parsec-scale Galactic 3D dust map out to 1.25 kpc from the Sun
Authors
Gordian Edenhofer, Catherine Zucker, Philipp Frank, Andrew K. Saydjari, Joshua S. Speagle, Douglas Finkbeiner, Torsten Enßlin
Abstract
High-resolution 3D maps of interstellar dust are critical for probing the underlying physics shaping the structure of the interstellar medium, and for foreground correction of astrophysical observations affected by dust. We aim to construct a new 3D map of the spatial distribution of interstellar dust extinction out to a distance of 1.25 kpc from the Sun. We leveraged distance and extinction estimates to 54 million nearby stars derived from the Gaia BP/RP spectra. Using the stellar distance and extinction information, we inferred the spatial distribution of dust extinction. We modeled the logarithmic dust extinction with a Gaussian process in a spherical coordinate system via iterative charted refinement and a correlation kernel inferred in previous work. In total, our posterior has over 661 million degrees of freedom. We probed the posterior distribution using the variational inference method MGVI. Our 3D dust map has an angular resolution of up to 14' (Nside = 256), and we achieve parsec-scale distance resolution, sampling the dust in 516 logarithmically spaced distance bins spanning 69 pc to 1250 pc. We generated 12 samples from the variational posterior of the 3D dust distribution and release the samples alongside the mean 3D dust map and its corresponding uncertainty. Our map resolves the internal structure of hundreds of molecular clouds in the solar neighborhood and will be broadly useful for studies of star formation, Galactic structure, and young stellar populations. It is available for download in a variety of coordinate systems online and can also be queried via the publicly available dustmaps Python package.
Concepts
The Big Picture
Imagine navigating a foggy city by mapping the fog itself. Not just noting “it’s foggy,” but pinpointing exactly where each wisp of mist hangs, block by block. That’s roughly what astronomers face when studying the Milky Way. Interstellar dust (tiny grains of carbon and silicates drifting between the stars) blurs our view of the cosmos, reddens starlight, and hides entire stellar nurseries from sight. To do serious astronomy, you need to know exactly where that dust lives.
Reconstructing a precise three-dimensional dust map from starlight observations is a brutal computational challenge, something like building a weather map from photographs of shadows. Previous attempts either captured fine detail over small regions or broad structure over large ones, rarely both.
A team led by Gordian Edenhofer at the Max Planck Institute for Astrophysics, working with collaborators at Harvard & Smithsonian and the University of Toronto, has now produced a 3D dust map of the solar neighborhood. It covers a sphere stretching 1,250 parsecs (roughly 4,000 light-years) in every direction from the Sun, sharp enough to reveal the internal architecture of individual molecular clouds where stars are born.
Key Insight: By combining 54 million stellar measurements from the Gaia satellite with a statistical framework designed for spherical geometry, the team mapped interstellar dust at finer resolution than any previous effort, enough to resolve structure inside individual star-forming clouds.
How It Works
The raw material comes from the ZGR23 catalog: distance and extinction (dust-induced dimming) estimates for 54 million nearby stars. These were derived from Gaia’s low-resolution BP/RP spectra (rough measurements of how each star’s light is distributed across wavelengths), combined with infrared brightness data from the 2MASS and WISE sky surveys. Each star acts as a probe: its apparent reddening reveals how much dust lies along the line of sight, and its distance pins down exactly where that dust sits.
The core challenge is the “fingers-of-god” effect, a smearing artifact where dust structures appear stretched along the line of sight because distance estimates are always less precise than sky positions. Previous spherical-coordinate maps suffered badly from this.
The solution is Iterative Charted Refinement (ICR), a framework that applies a Gaussian process prior inside a spherical coordinate system. The GP acts as a statistical smoothing constraint: it penalizes jagged fluctuations and enforces spatial continuity. Its smoothing parameters were calibrated from earlier observational data, so the model encodes physically realistic assumptions without becoming computationally intractable.
The map’s scale is worth pausing on. Key grid parameters:
- 661 million degrees of freedom, the independent values the model must determine
- 516 distance shells spaced logarithmically from 69 to 1,250 parsecs
- Angular resolution as fine as 14 arcminutes (roughly one-quarter the apparent width of the full Moon)
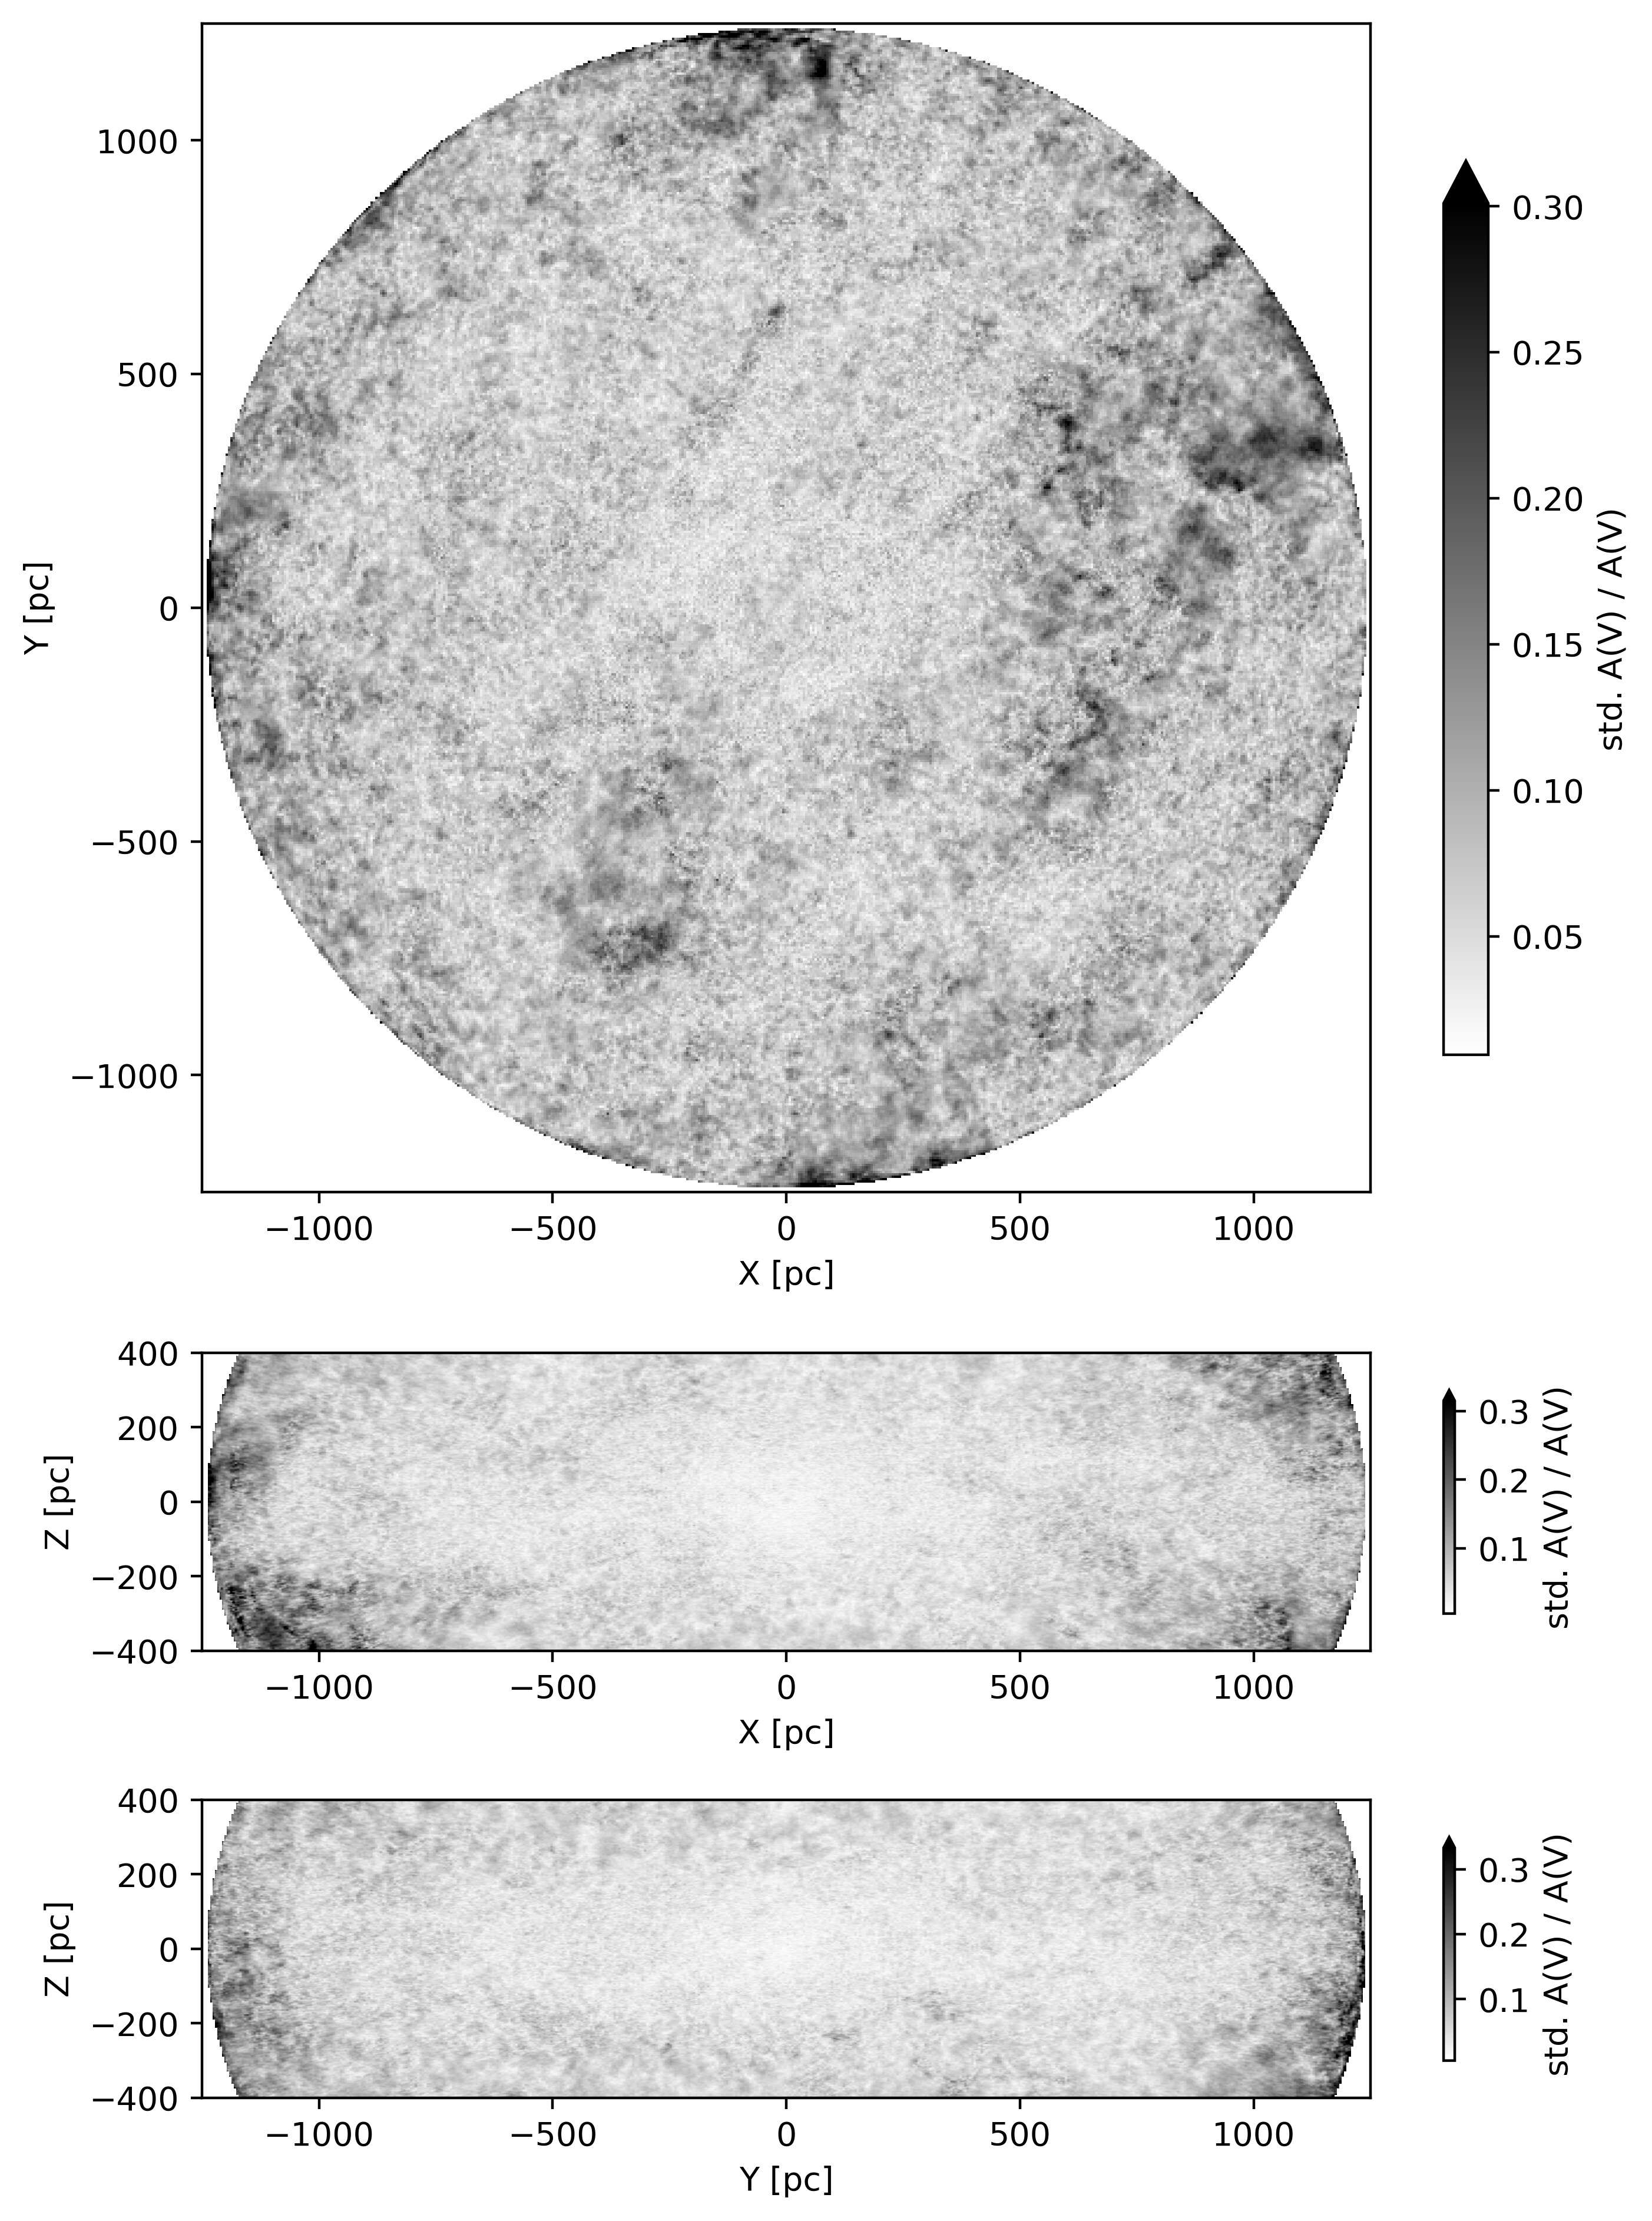
To explore this vast parameter space, the team used MGVI (Metric Gaussian Variational Inference), which approximates the full range of plausible dust maps with a mathematically tractable stand-in. The alternative, exhaustive Markov chain Monte Carlo sampling, would be computationally impossible at this scale. The output is not just a single mean map but 12 full posterior samples: independent snapshots of plausible dust configurations that together capture genuine uncertainty at every point in the volume.
Why It Matters
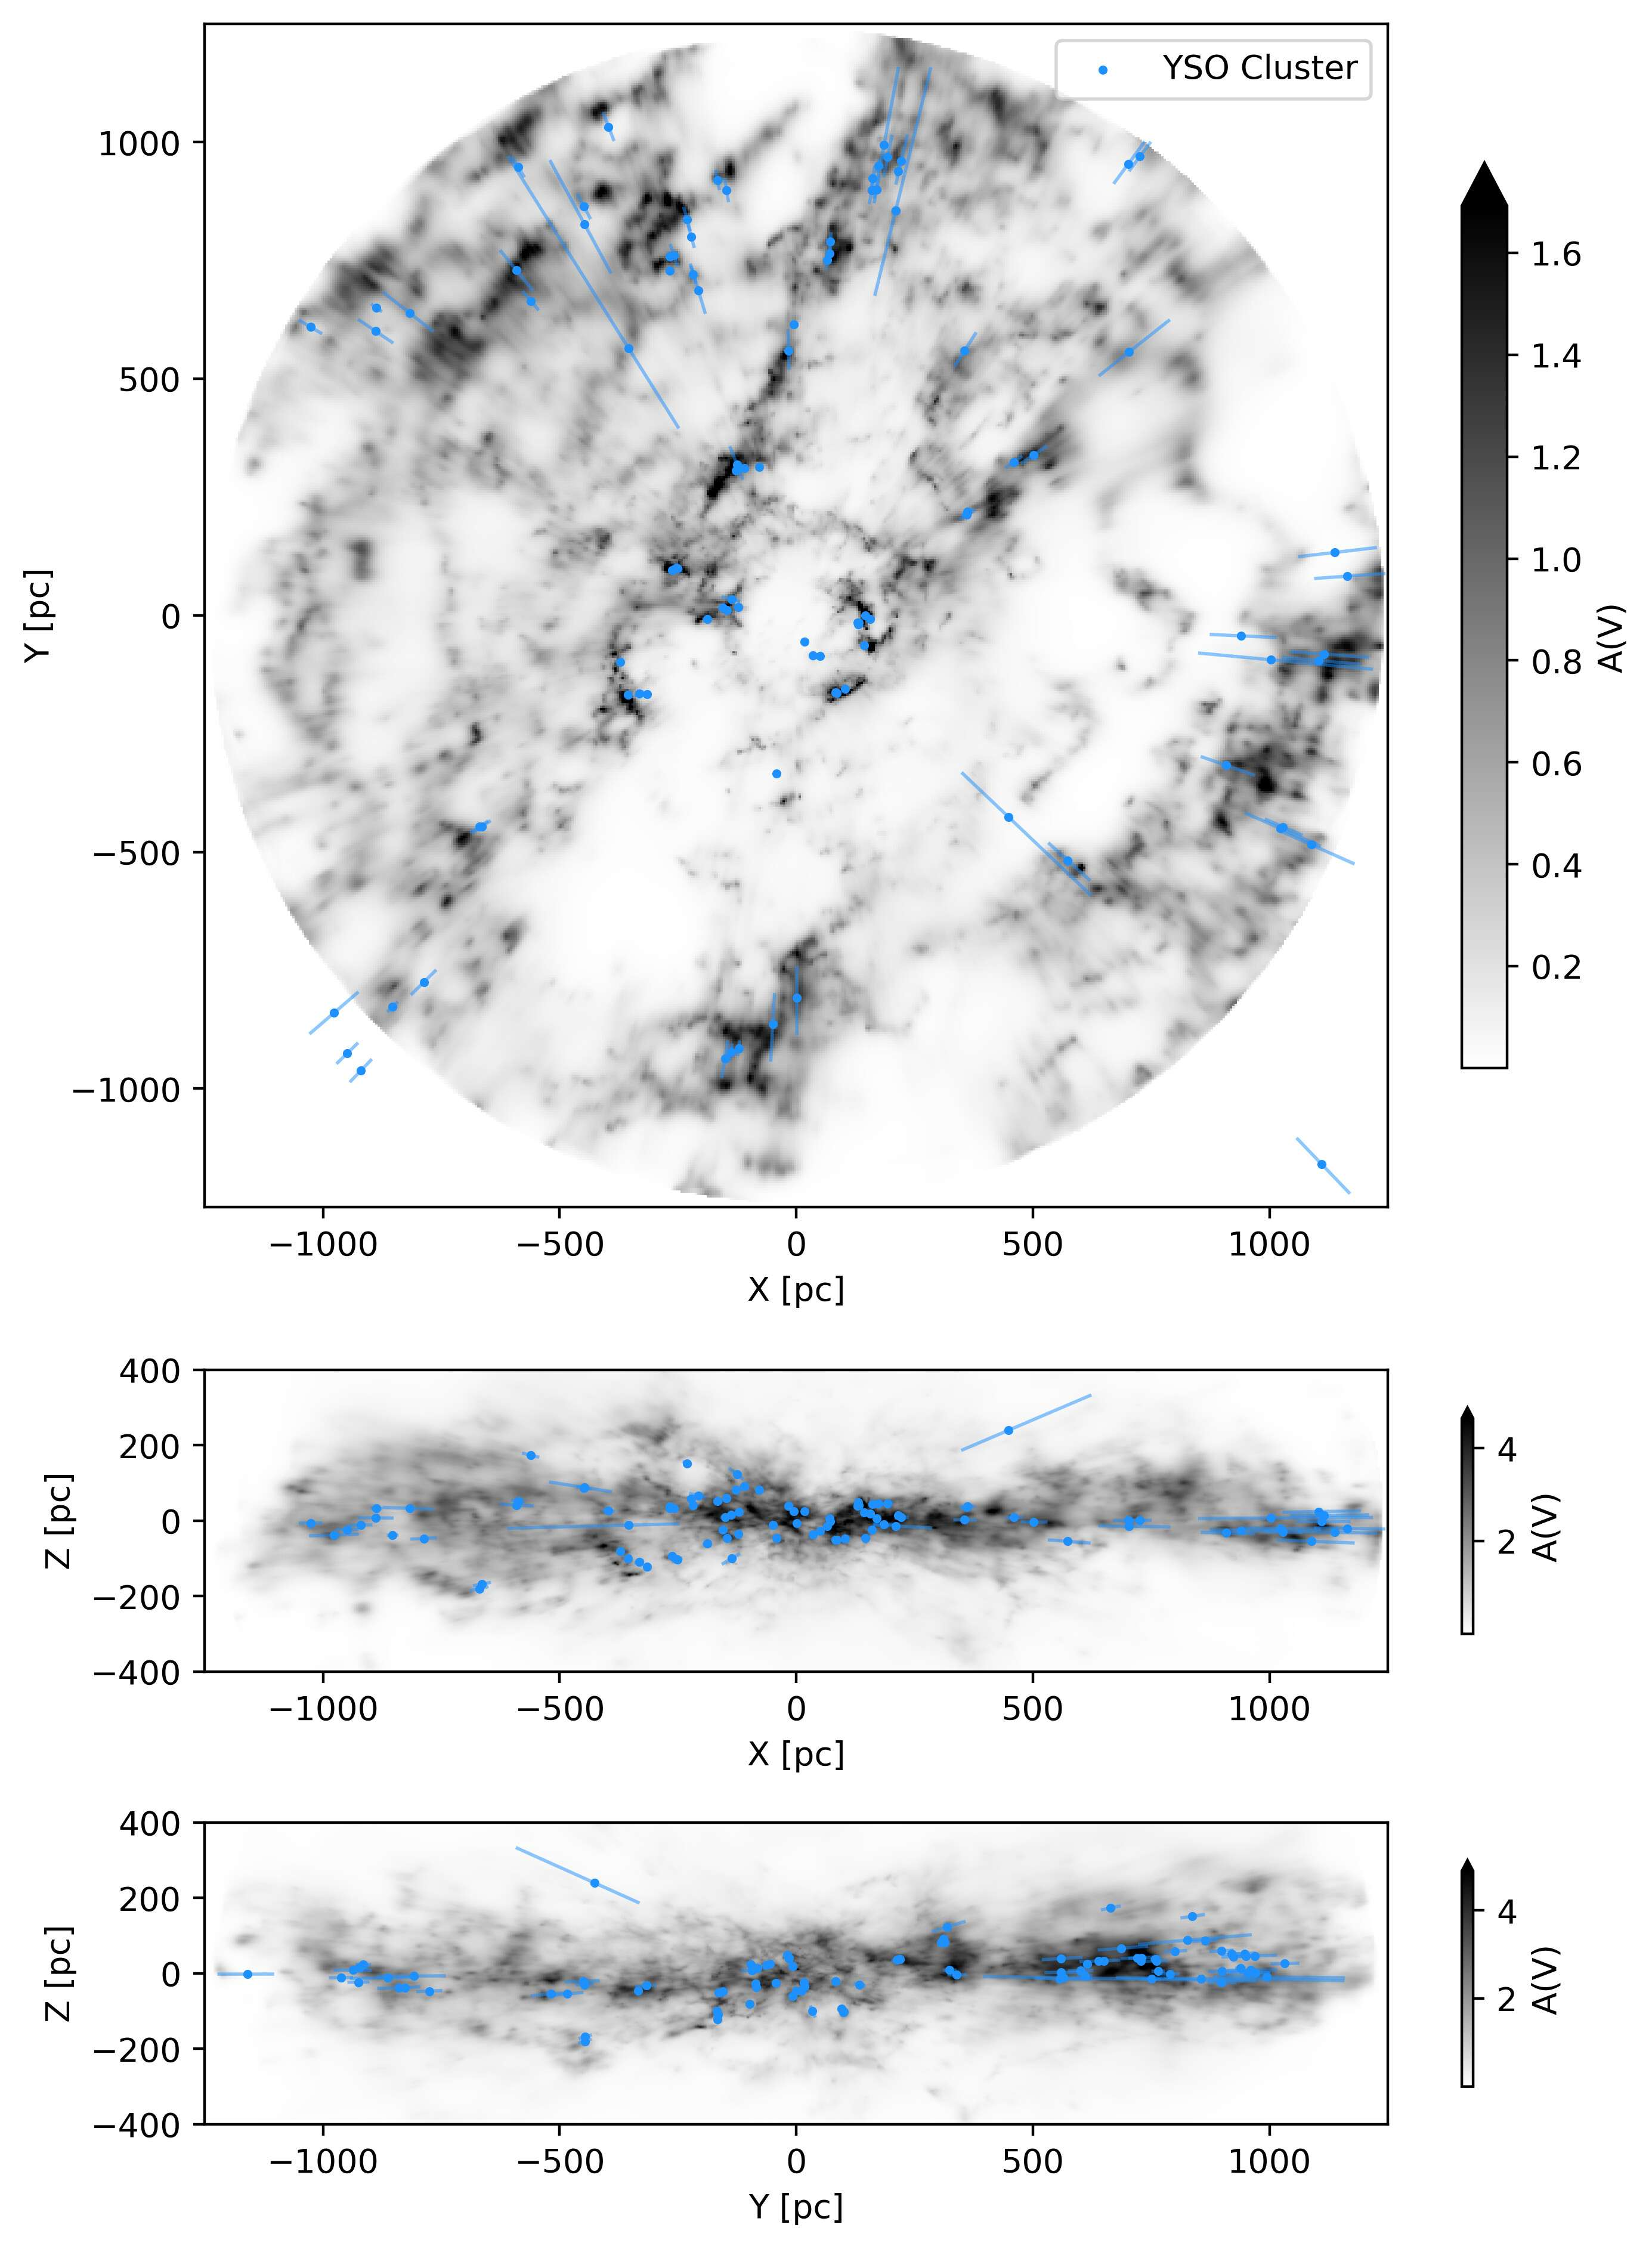
The immediate payoff is scientific. This map resolves the internal structure of hundreds of molecular clouds in the solar neighborhood, the dense, cold regions where stars form.
Star formation researchers can now trace filaments, voids, and dense cores at parsec scales across a wide area, detail that was simply unavailable at this volume before. The map also sharpens studies of young stellar populations and Galactic structure, since knowing where the dust is tells you where star formation has recently occurred.
The benefits reach well beyond the Milky Way. Interstellar dust contaminates a surprising range of observations: it dims supernovae used to measure cosmic expansion, muddles cosmic microwave background polarization maps, and biases photometric redshifts of distant galaxies. A high-resolution foreground dust map improves the accuracy of all those measurements.
The team has made the map publicly available in multiple coordinate systems and queryable through the widely used dustmaps Python package, so the broader community can plug it into existing workflows immediately.
The methodological advance may prove equally lasting. Gaussian processes on spherical grids with variational inference at hundred-million-parameter scales offer a template for massive spatial reconstruction problems across astrophysics and in other fields.
Bottom Line: This 3D dust map is the most detailed picture yet of the interstellar medium in our cosmic backyard. It was built by combining Gaia’s billion-star dataset with scalable Bayesian inference, and it’s already freely available for any researcher who needs to see through the fog.
IAIFI Research Highlights
Large-scale Bayesian inference and Gaussian process machine learning directly enabled this Galactic astrophysics result, a clear case where AI methods and physics expertise had to work together to produce something neither community could have reached alone.
The use of variational inference (MGVI) and iterative charted refinement to explore posteriors with over 661 million degrees of freedom sets a new bar for scalable probabilistic modeling of high-dimensional spatial fields.
The parsec-resolution map of the solar neighborhood will sharpen our understanding of star formation physics, Galactic structure, and dust-sensitive cosmological probes including CMB polarization foregrounds and Type Ia supernova distances.
Future work will push toward larger distances, higher angular resolution, and integration with new spectroscopic surveys. The map and methodology are described in Edenhofer et al. (2024), [arXiv:2308.01295](https://arxiv.org/abs/2308.01295).