
Hierarchical Simulation-Based Inference of Supernova Power Sources and their Physical Properties
Authors
Edgar P. Vidal, Alexander T. Gagliano, Carolina Cuesta-Lazaro
Abstract
Time domain surveys such as the Vera C. Rubin Observatory are projected to annually discover millions of astronomical transients. This and complementary programs demand fast, automated methods to constrain the physical properties of the most interesting objects for spectroscopic follow up. Traditional approaches to likelihood-based inference are computationally expensive and ignore the multi-component energy sources powering astrophysical phenomena. In this work, we present a hierarchical simulation-based inference model for multi-band light curves that 1) identifies the energy sources powering an event of interest, 2) infers the physical properties of each subclass, and 3) separates physical anomalies in the learned embedding space. Our architecture consists of a transformer-based light curve summarizer coupled to a flow-matching regression module and a categorical classifier for the physical components. We train and test our model on $\sim$150k synthetic light curves generated with $\texttt{MOSFiT}$. Our network achieves a 90% classification accuracy at identifying energy sources, yields well-calibrated posteriors for all active components, and detects rare anomalies such as tidal disruption events (TDEs) through the learned latent space. This work demonstrates a scalable joint framework for population studies of known transients and the discovery of novel populations in the era of Rubin.
Concepts
The Big Picture
Imagine you’re a detective, but instead of fingerprints, you’re reading starlight. A star explodes somewhere in the cosmos, a supernova, and all you have is a flickering light curve: brightness measurements across multiple colors over days and weeks.
Inside that dying star, multiple physical engines could be running simultaneously. A radioactive heart of nickel-56 decaying. A magnetar (a city-sized spinning magnet, the ultra-dense remnant of the stellar core) dumping energy into the explosion as it slows down. Dense shells of gas the star had shed before death, now getting slammed by the blast wave. Each engine leaves overlapping fingerprints, and you need to sort them out. Fast, automatically, and for potentially millions of events per year.
That’s what astronomers face with the upcoming Vera C. Rubin Observatory, a telescope in Chile that will scan the entire southern sky every few nights and is projected to discover millions of cosmic explosions annually. The old approach, running expensive case-by-case simulations to fit each event, simply won’t scale. Existing automated methods typically assume only one energy source is active, which is often physically wrong.
Researchers Edgar Vidal, Alexander Gagliano, and Carolina Cuesta-Lazaro have built a hierarchical AI framework that simultaneously identifies which physical engines are powering a supernova and precisely how each one is configured, all from the light curve alone.
Key Insight: Instead of assuming a single dominant power source, this model treats supernovae as they actually are (potentially multi-component systems) and learns to disentangle those components jointly, not sequentially.
How It Works
The framework has three tightly coupled pieces, all trained together on roughly 150,000 synthetic light curves generated with MOSFiT (the Modular Open Source Fitter for Transients), a simulation tool that models combined emission from multiple physical engines.
1. A transformer-based light curve summarizer. This neural network architecture, borrowed from language AI but adapted for irregular, multi-color brightness data, takes observations as time-magnitude pairs, uses positional markers to track when each measurement was taken, and distills everything into a compact 64-dimensional fingerprint of each event. This summary vector feeds everything downstream.
2. A categorical classifier. Three candidate power sources (radioactive nickel decay, circumstellar material interaction where the blast wave slams into gas the star shed before dying, and magnetar spin-down) can appear alone or in any combination, giving seven possible non-empty subsets. The classifier assigns probabilities to all seven simultaneously, achieving 90% accuracy across all model types.
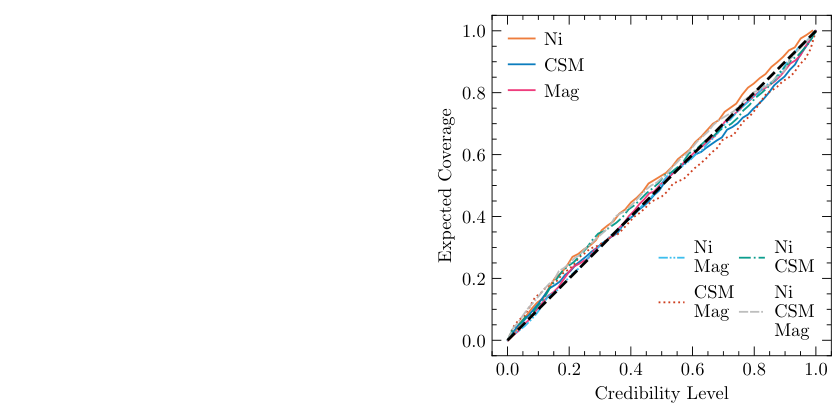
3. A flow-matching regression module. Given both the summary fingerprint and the classifier’s output, this component produces full probability distributions over physical parameters (ejecta mass, explosion velocity, CSM density, magnetar spin period, magnetic field strength) rather than single-point guesses. Because it conditions on the source classification, it doesn’t waste capacity estimating magnetar parameters for explosions with no magnetar.
The hierarchical structure is what makes it work: a shared representation layer, a discrete decision layer, and a conditional estimation layer, all co-trained so each component sharpens the others.
Why It Matters
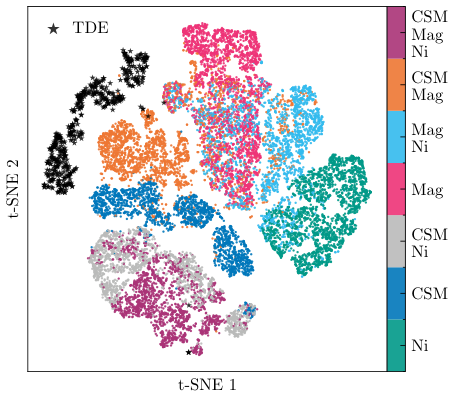
The system does something traditional pipelines couldn’t manage cleanly: it finds anomalies without being told what to look for. The 64-dimensional summary space isn’t just a classifier input. It’s a structured map where physically similar events cluster together.
When the researchers fed in tidal disruption events (TDEs, caused by stars being shredded by black holes, a completely different class of transient), the model had never seen them during training. Yet these events landed far from all supernova clusters in the learned space, flagged as outliers purely from their geometric isolation. A telescope doing blind surveys will encounter genuinely unknown phenomena, and this system catches them automatically.
This matters because of the coming data flood from Rubin. Spectroscopic follow-up, the gold standard for understanding a transient, is a limited and expensive resource. Astronomers need to prioritize which events get telescope time. A fast, automated system that correctly identifies power sources, produces calibrated uncertainty estimates, and highlights genuine anomalies changes how that prioritization works.
The framework is also built for population studies: not just characterizing individual events, but mapping the distribution of physical parameters across entire classes of explosions. That tells you about the diversity of stellar deaths across cosmic time.
Open questions remain. The model was trained on MOSFiT synthetic data, and real observations will bring noise, cadence gaps, and astrophysical messiness that simulations may not fully capture. Closing that gap and extending the framework to handle more exotic transient classes is the natural next step.
Bottom Line: A single AI framework now handles source identification, physical parameter estimation, and anomaly detection for supernovae, with 90% classification accuracy and calibrated uncertainties, ready for the Rubin era.
IAIFI Research Highlights
This work co-designs transformer and flow-matching architectures with a physical model hierarchy, embedding modern deep learning directly into the supernova energy source identification problem rather than applying it as an afterthought.
The hierarchical posterior factorization, where a shared summarizer feeds both a categorical classifier and a conditional density estimator, offers a generalizable pattern for structured multi-task inference under physical constraints.
By enabling simultaneous multi-component inference at scale, this framework opens systematic population-level measurements of magnetar birth properties, CSM geometries, and radioactive yields across thousands of supernovae, directly constraining stellar evolution and explosion physics.
As the Rubin Observatory begins its Legacy Survey of Space and Time, extensions handling photometric noise, irregular cadence, and novel transient classes will be critical; the full paper is available at [arXiv:2510.14202](https://arxiv.org/abs/2510.14202).
Original Paper Details
Hierarchical Simulation-Based Inference of Supernova Power Sources and their Physical Properties
2510.14202
["Edgar P. Vidal", "Alexander T. Gagliano", "Carolina Cuesta-Lazaro"]
Time domain surveys such as the Vera C. Rubin Observatory are projected to annually discover millions of astronomical transients. This and complementary programs demand fast, automated methods to constrain the physical properties of the most interesting objects for spectroscopic follow up. Traditional approaches to likelihood-based inference are computationally expensive and ignore the multi-component energy sources powering astrophysical phenomena. In this work, we present a hierarchical simulation-based inference model for multi-band light curves that 1) identifies the energy sources powering an event of interest, 2) infers the physical properties of each subclass, and 3) separates physical anomalies in the learned embedding space. Our architecture consists of a transformer-based light curve summarizer coupled to a flow-matching regression module and a categorical classifier for the physical components. We train and test our model on $\sim$150k synthetic light curves generated with $\texttt{MOSFiT}$. Our network achieves a 90% classification accuracy at identifying energy sources, yields well-calibrated posteriors for all active components, and detects rare anomalies such as tidal disruption events (TDEs) through the learned latent space. This work demonstrates a scalable joint framework for population studies of known transients and the discovery of novel populations in the era of Rubin.