
Photometrically-Classified Superluminous Supernovae from the Pan-STARRS1 Medium Deep Survey: A Case Study for Science with Machine Learning-Based Classification
Authors
Brian Hsu, Griffin Hosseinzadeh, V. Ashley Villar, Edo Berger
Abstract
With the upcoming Vera C.~Rubin Observatory Legacy Survey of Space and Time (LSST), it is expected that only $\sim 0.1\%$ of all transients will be classified spectroscopically. To conduct studies of rare transients, such as Type I superluminous supernovae (SLSNe), we must instead rely on photometric classification. In this vein, here we carry out a pilot study of SLSNe from the Pan-STARRS1 Medium-Deep Survey (PS1-MDS) classified photometrically with our SuperRAENN and Superphot algorithms. We first construct a sub-sample of the photometric sample using a list of simple selection metrics designed to minimize contamination and ensure sufficient data quality for modeling. We then fit the multi-band light curves with a magnetar spin-down model using the Modular Open-Source Fitter for Transients (MOSFiT). Comparing the magnetar engine and ejecta parameter distributions of the photometric sample to those of the PS1-MDS spectroscopic sample and a larger literature spectroscopic sample, we find that these samples are overall consistent, but that the photometric sample extends to slower spins and lower ejecta masses, which correspond to lower luminosity events, as expected for photometric selection. While our PS1-MDS photometric sample is still smaller than the overall SLSN spectroscopic sample, our methodology paves the way to an orders-of-magnitude increase in the SLSN sample in the LSST era through photometric selection and study.
Concepts
The Big Picture
Imagine trying to identify faces in a crowd of millions while only being allowed to study a handful up close. That’s the challenge facing astronomers as next-generation sky surveys prepare to sweep the heavens at unprecedented scale. The universe will soon be throwing cosmic events at us faster than we can study them, and some of the most spectacular explosions in existence might slip through our fingers.
Superluminous supernovae are the universe’s most extreme stellar deaths, outshining ordinary supernovae by 10 to 100 times and briefly radiating more light than entire galaxies. They’re also vanishingly rare.
Proper classification traditionally requires spectroscopy, a technique that splits an object’s light into its component wavelengths to reveal its composition, much like a prism breaking white light into a rainbow. That means pointing a specialized instrument at each individual event and watching it long enough to decode its light signature. With the upcoming Vera C. Rubin Observatory’s Legacy Survey of Space and Time (LSST) expected to detect millions of brief celestial flashes per year, detailed follow-up will be feasible for only about 0.1% of them.
A team led by Brian Hsu at the Center for Astrophysics at Harvard & Smithsonian has shown that machine learning can fill that gap. Their classifiers don’t just flag superluminous supernovae from brightness patterns alone; the resulting sample actually yields real, quantitative physics.
Key Insight: Machine learning classifiers can identify superluminous supernovae from light curves alone with results consistent with spectroscopic confirmation, opening a path to studying thousands of these extreme explosions in the LSST era.
How It Works
The team drew on data from the Pan-STARRS1 Medium Deep Survey (PS1-MDS), a multi-year sky survey that monitored patches of sky in multiple color filters, capturing how thousands of objects brightened and faded over time. They fed light curve data into two independent machine learning classifiers: SuperRAENN, which combines a recurrent autoencoder neural network with a random forest classifier, and Superphot, a random forest approach trained on flexible analytic fits to light curve shapes.
Between the two algorithms, 67 events were flagged as superluminous supernova candidates. That brightness-based sample then passed through a series of quality filters:
- AGN rejection: Active galactic nuclei, the intensely bright cores of galaxies powered by feeding black holes, can mimic supernova light curves. Events in known AGN host galaxies were removed.
- Redshift availability: A galaxy’s redshift measures how much its light has been stretched by cosmic expansion, revealing its distance. Events without host redshift measurements couldn’t be placed in physical context and were cut.
- Data quality thresholds: Events needed sufficient multi-color brightness measurements across multiple filters to support physical modeling.
- Convergence cuts: Events whose model fits failed to settle on a stable solution were excluded.
After filtering, the refined sample underwent the centerpiece analysis: fitting each event’s multi-band light curve with a magnetar spin-down model. This model treats the supernova as powered by a rapidly spinning, intensely magnetized neutron star (a magnetar) whose rotational energy gets deposited into the shell of gas blasted outward in the explosion. Using the open-source MOSFiT code, the team extracted physical parameters including magnetar spin period, magnetic field strength, and ejecta mass.
Why It Matters
The core question: does photometric classification tell you the same physics story as spectroscopic confirmation?
Yes. With an illuminating twist.
When the team compared parameter distributions from the photometric PS1-MDS sample against both the spectroscopic PS1-MDS sample and a broader literature compilation, they found broad consistency. Magnetar spin periods, magnetic field strengths, and ejecta masses occupied largely the same ranges across all three samples. The ML classifiers are finding real superluminous supernovae, not impostors.
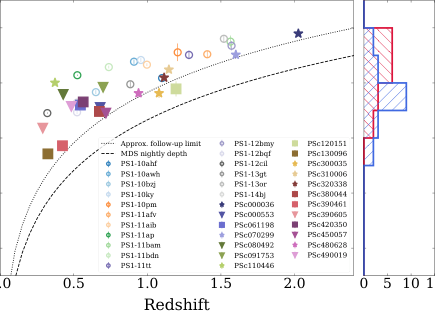
But the photometric sample reached into territory the spectroscopic samples didn’t: slower magnetar spins and lower ejecta masses, corresponding to intrinsically fainter events. The reason is straightforward. Spectroscopic follow-up is brightness-limited. Observers chase the most dramatic events. Photometric selection, free of that bias, naturally recovers the dimmer tail of the population.
That’s not a flaw. The photometric sample reveals a part of the superluminous supernova population that traditional campaigns systematically miss.
The stakes get much higher with LSST, which is expected to discover roughly 10,000 superluminous supernovae per year out to redshift ~3. If each required spectroscopic confirmation, population-level science would be impossible. But if magnetar engine parameters can be extracted from light curves alone, and trusted to match spectroscopic ground truth, then LSST becomes a superluminous supernova physics machine on a scale we’ve never had.
The methodology here (photometric classification, quality filtering, Bayesian light curve fitting) is ready to scale. And by recovering the low-luminosity tail of the SLSN population, photometric surveys could finally test whether the magnetar model holds across the full range of these explosions, or whether different physics takes over at lower energies. Open questions about circumstellar interaction and the relationship between SLSNe and gamma-ray bursts would all benefit from a sample enlarged by orders of magnitude.
Bottom Line: Classifying superluminous supernovae from brightness patterns alone and successfully recovering their physical parameters shows that machine learning can unlock the science of these extreme explosions at a scale spectroscopy never could. This is the playbook for LSST-era astronomy.
IAIFI Research Highlights
This work fuses machine learning classification pipelines with astrophysical modeling, showing that ML-derived samples can support serious quantitative science. It's a working example of how to combine computational methods with observational cosmology.
The study validates two independent ML photometric classifiers (SuperRAENN and Superphot) against spectroscopic ground truth, providing direct evidence that semi-supervised and random-forest approaches can reliably identify rare transient classes at scale.
By recovering magnetar spin and ejecta parameters from photometric data alone, and uncovering the previously hidden low-luminosity tail of the SLSN population, the work advances our understanding of the extreme physics powering the universe's most energetic stellar explosions.
As LSST comes online and photometric datasets grow by orders of magnitude, the methodology developed here will be essential for turning raw survey data into population-level physics; the paper is available at [arXiv:2204.09809](https://arxiv.org/abs/2204.09809).