
Toward Automatic Interpretation of 3D Plots
Authors
Laura E. Brandt, William T. Freeman
Abstract
This paper explores the challenge of teaching a machine how to reverse-engineer the grid-marked surfaces used to represent data in 3D surface plots of two-variable functions. These are common in scientific and economic publications; and humans can often interpret them with ease, quickly gleaning general shape and curvature information from the simple collection of curves. While machines have no such visual intuition, they do have the potential to accurately extract the more detailed quantitative data that guided the surface's construction. We approach this problem by synthesizing a new dataset of 3D grid-marked surfaces (SurfaceGrid) and training a deep neural net to estimate their shape. Our algorithm successfully recovers shape information from synthetic 3D surface plots that have had axes and shading information removed, been rendered with a variety of grid types, and viewed from a range of viewpoints.
Concepts
The Big Picture
Flip through a scientific paper and you’ll eventually hit a 3D surface plot: a rippling mesh of curves representing a potential energy landscape, a risk surface, something with peaks and valleys and ridges. Your brain processes it almost instantly. You see the shape. Now try getting a computer to do the same thing. What felt effortless becomes fiendishly hard.
This is the problem Laura Brandt and William Freeman at MIT CSAIL took on. Thousands of 3D surface plots are published every year across scientific disciplines, each encoding quantitative data in a form that humans read fluently but machines cannot parse. Tools exist to extract data from 2D charts (bar graphs, scatter plots, pie charts), but for 3D plots, there has been nothing. The data locked inside those rippling grids has been inaccessible to automated systems.
Their approach: build a dataset from scratch, train a deep neural network on it, and show that a machine can learn to recover 3D shape from the same visual cues that human vision relies on, those sparse crossing lines on the surface.
Key Insight: A neural network trained on a purpose-built synthetic dataset can recover 3D shape information from grid-marked surface plots, even when axes and shading are stripped away entirely.
How It Works
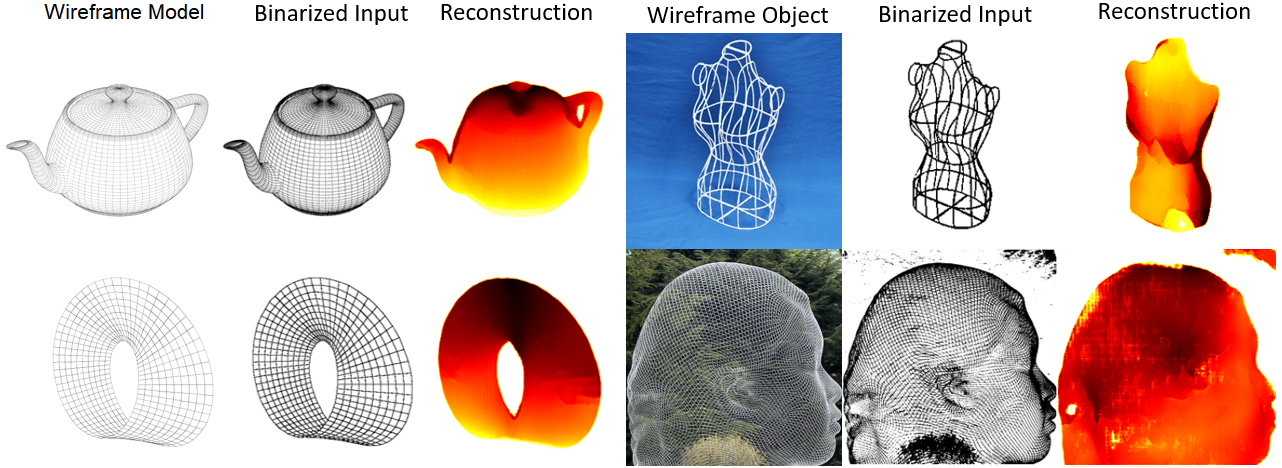
The core task is shape recovery from grid-marked surfaces. Given an image of a 3D surface plot with no axis labels, no color scales, and no shading, can a neural network reconstruct what the underlying surface actually looks like?
No large dataset of 3D surface plots paired with ground-truth shape information existed, so the team built one. SurfaceGrid contains 98,600 images of 3D grid-marked surfaces rendered alongside their corresponding depth maps, pixel-by-pixel records of how far each point on the surface sits from the camera. Depth maps encode 3D shape as a 2D image, making them a natural training target.
Generating SurfaceGrid required careful engineering of variability. The synthetic plots were rendered with multiple grid types (different line densities, colors, and styles mimicking real-world figure diversity), varied viewpoints as the virtual camera orbited surfaces, and no shading or axis information at all. That last choice was deliberate. Shading varies wildly between software packages, and axis labels need separate handling. Training on “naked” grid surfaces forces the model to learn the hardest part of the problem first.
The neural network uses a convolutional encoder-decoder architecture: it compresses an image into a compact internal representation, then expands it back into a depth map. The encoder extracts features from the input grid image; the decoder reconstructs depth from those features. The team also ran ablation studies, systematically removing or altering individual design choices to identify which ones mattered most.
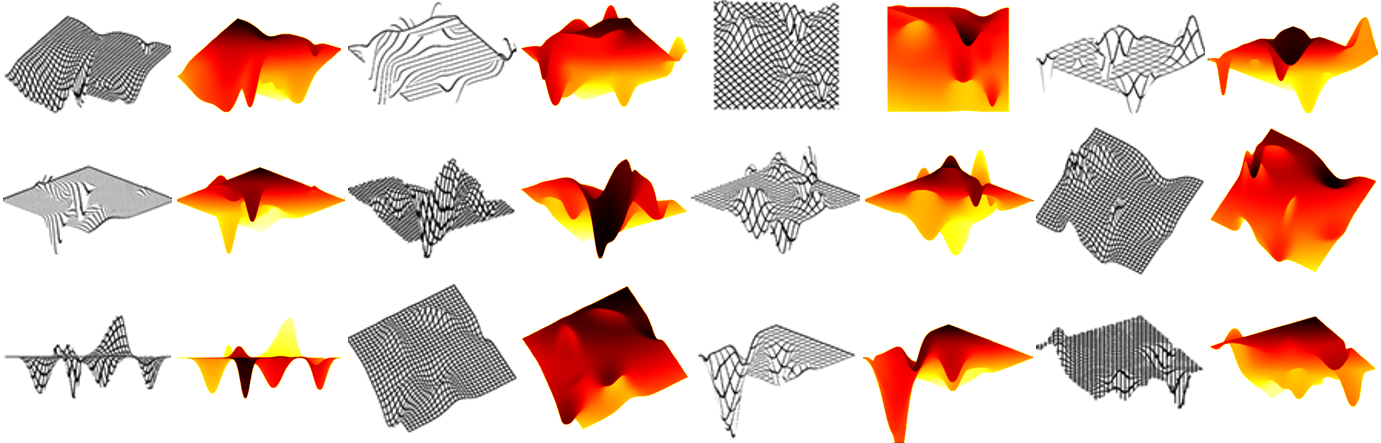
Across diverse synthetic conditions, the algorithm successfully recovers shape. The model generalizes across the visual variation baked into SurfaceGrid, a necessary prerequisite for tackling real published figures.
Why It Matters
The immediate payoff is practical: automated data extraction from scientific literature. Millions of published figures contain quantitative information currently invisible to search engines and indexing systems. A system that could read 3D plots the way existing tools query tables would transform how researchers navigate the scientific record. Instead of keyword searches, you could query by data shape: find me all papers whose potential energy surfaces have a double-well structure in this region.
But the implications go beyond literature mining. The broader problem, shape-from-X (reconstructing 3D geometry from 2D image cues), is one of the oldest challenges in computer vision. Prior work by Marr, Stevens, Weiss, and others relied on hand-crafted geometric assumptions: surfaces are locally cylindrical, contours behave like springs, viewpoints are generic. Those assumptions break down in the messy context of real scientific plots.
Brandt and Freeman’s data-driven approach sidesteps them entirely, letting the network learn what constraints actually hold in the distribution of real 3D plots. The SurfaceGrid dataset itself is a standalone contribution, a resource for figure understanding, document analysis, and scientific data recovery that others can build on.
Open questions remain. The current work uses only synthetic data. Bridging to real published figures requires handling axis detection, legend separation, and calibration, steps the authors flag as future work. Recovering actual numerical values also requires a deprojection step to undo the perspective transformation applied when the figure was originally rendered.
Bottom Line: Brandt and Freeman have cracked open the 3D plot problem, creating the first dataset and model for automated shape recovery from grid-marked surfaces. The next step is real-world figures, but the foundation is here.
IAIFI Research Highlights
This work connects computer vision and scientific data extraction, developing tools that could automate the interpretation of 3D figures across physics, chemistry, and other quantitative sciences.
The SurfaceGrid dataset (98,600 synthetic images with paired depth maps) and the trained encoder-decoder model establish a new benchmark for the underexplored problem of 3D chart interpretation.
Automated 3D plot reading could speed up literature discovery in physics and related fields, letting researchers search scientific databases by data content rather than keywords alone.
Future work will extend the pipeline to handle axis calibration, deprojection, and real-world published figures. The paper is available at [arXiv:2106.07627](https://arxiv.org/abs/2106.07627).