
Unveiling the Diversity of Type IIn Supernovae via Systematic Light Curve Modeling
Authors
C. L. Ransome, V. A. Villar
Abstract
Type IIn supernovae (SNeIIn) are a highly heterogeneous subclass of core-collapse supernovae, spectroscopically characterized by signatures of interaction with a dense circumstellar medium (CSM). Here we systematically model the light curves of 142 archival SNeIIn using MOSFiT (the Modular Open Source Fitter for Transients). We find that the observed and inferred properties of SNIIn are diverse, but there are some trends. The typical SN CSM is dense ($\sim$10$^{-12}$gcm$^{-3}$) with highly diverse CSM geometry, with a median CSM mass of $\sim$1M$_\odot$. The ejecta are typically massive ($\gtrsim10$M$_\odot$), suggesting massive progenitor systems. We find positive correlations between the CSM mass and the rise and fall times of SNeIIn. Furthermore there are positive correlations between the rise time and fall times and the $r$-band luminosity. We estimate the mass-loss rates of our sample (where spectroscopy is available) and find a high median mass-loss rate of $\sim$10$^{-2}$M$_\odot$yr$^{-1}$, with a range between 10$^{-4}$--1M$_\odot$yr$^{-1}$. These mass-loss rates are most similar to the mass loss from great eruptions of luminous blue variables, consistent with the direct progenitor detections in the literature. We also discuss the role that binary interactions may play, concluding that at least some of our SNeIIn may be from massive binary systems. Finally, we estimate a detection rate of 1.6$\times$10$^5$yr$^{-1}$ in the upcoming Legacy Survey of Space and Time at the Vera C. Rubin Observatory.
Concepts
The Big Picture
Imagine trying to understand a fireworks show by looking only at photographs taken from different locations, at different times, through windows of varying sizes. That’s roughly the challenge astronomers face when studying supernovae. Each explosion is unique, observed with different telescopes, at different distances, and with wildly different amounts of data.
C. L. Ransome and V. A. Villar took on this challenge for a particularly bizarre class of stellar explosions called Type IIn supernovae, a group so diverse it has long resisted systematic understanding. These aren’t ordinary stellar deaths. Type IIn supernovae are defined by a stranger mechanism: the dying star is surrounded by a thick shell of material it shed before exploding, and the collision between the explosion and that shell creates a long-lasting light show.
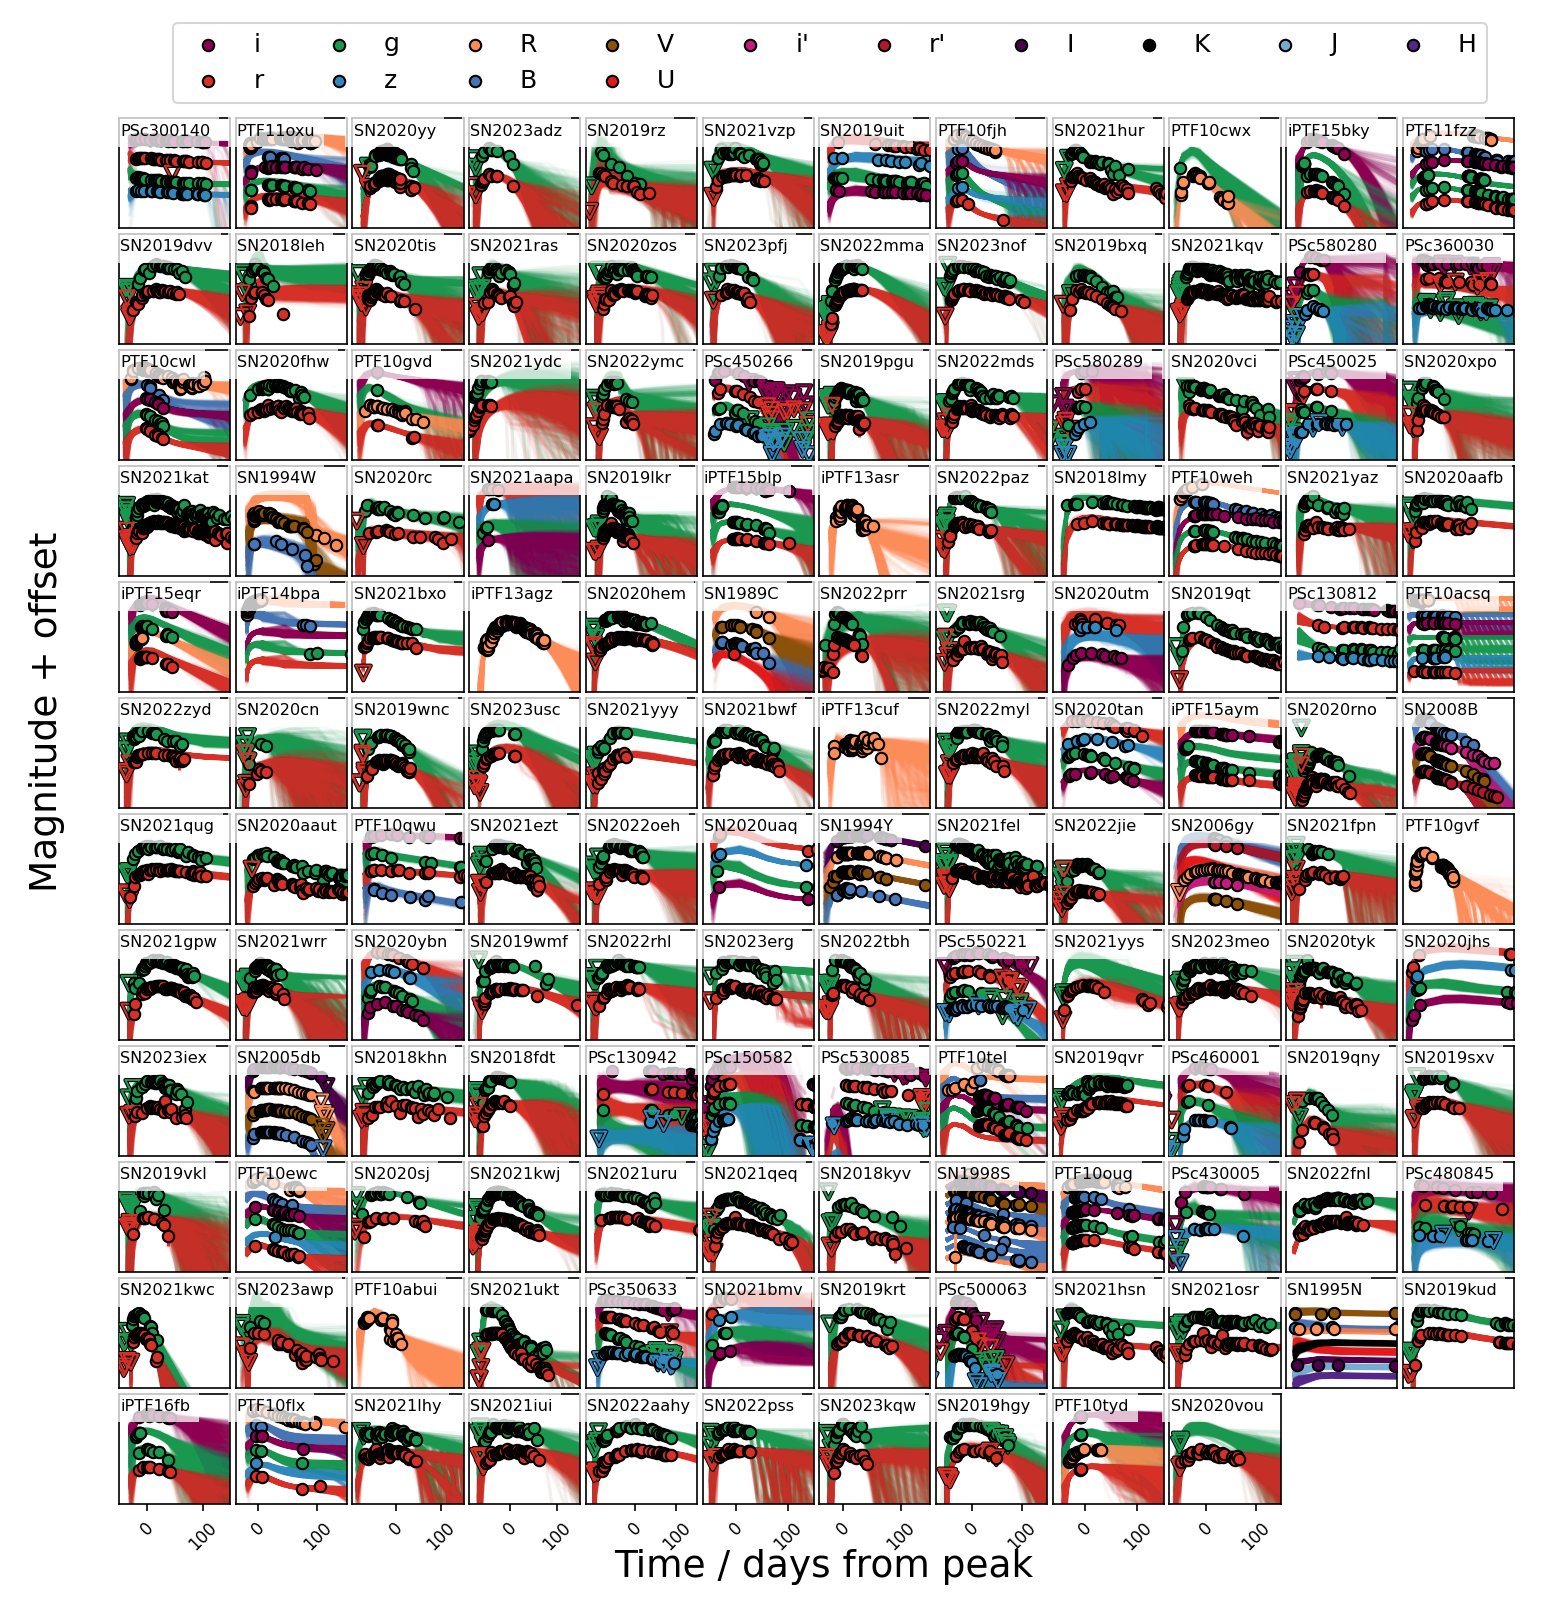
But why do some shine for weeks while others glow for decades? Why do their peak brightnesses vary a hundredfold? The answer is encoded in how stars shed mass in their final years, and reading that code required modeling 142 light curves (graphs tracking how each explosion’s brightness changes over time) all at once.
By systematically fitting the largest archival sample of Type IIn supernovae ever analyzed, Ransome and Villar extracted the hidden physical properties of these explosions and identified the first population-level trends in this notoriously unruly class.
Key Insight: The diversity of Type IIn supernovae traces back to the diversity of how their parent stars shed mass before dying, and the mass-loss rates observed most closely match the dramatic, irregular eruptions of luminous blue variables rather than steady stellar winds.
How It Works
The researchers used MOSFiT (Modular Open Source Fitter for Transients), an open-source tool that applies Bayesian inference to fit models to supernova light curves. Bayesian inference is a statistical method for combining physical models with observed data to estimate the most likely underlying properties. Rather than simply describing each curve’s shape, MOSFiT uses a physical model to infer what’s actually happening inside and around each explosion.
The pipeline worked in four steps:
- Data collection: Gather archival photometric observations (brightness measurements across multiple wavelengths) for 142 Type IIn supernovae from the literature.
- Physical modeling: Apply a CSM (circumstellar medium) interaction model, accounting for ejecta mass, explosion energy, CSM density, CSM geometry (spherical versus disk-like), and opacity (how transparent or opaque the surrounding gas and dust is).
- Bayesian inference: Use Markov Chain Monte Carlo sampling, a computational technique for systematically exploring which parameter combinations best fit the data, to find the range of values that best explain each light curve.
- Population analysis: Search across all 142 fits for correlations and trends revealing the underlying population.
The result is a set of inferred physical parameters for each supernova, quantities encoded in the light curve’s shape, duration, and brightness but impossible to observe directly. The circumstellar medium turns out to be dense, with a typical density around 10⁻¹² g/cm³ and a median mass of about one solar mass. The ejecta are typically massive, exceeding 10 solar masses, pointing toward heavy progenitor stars.
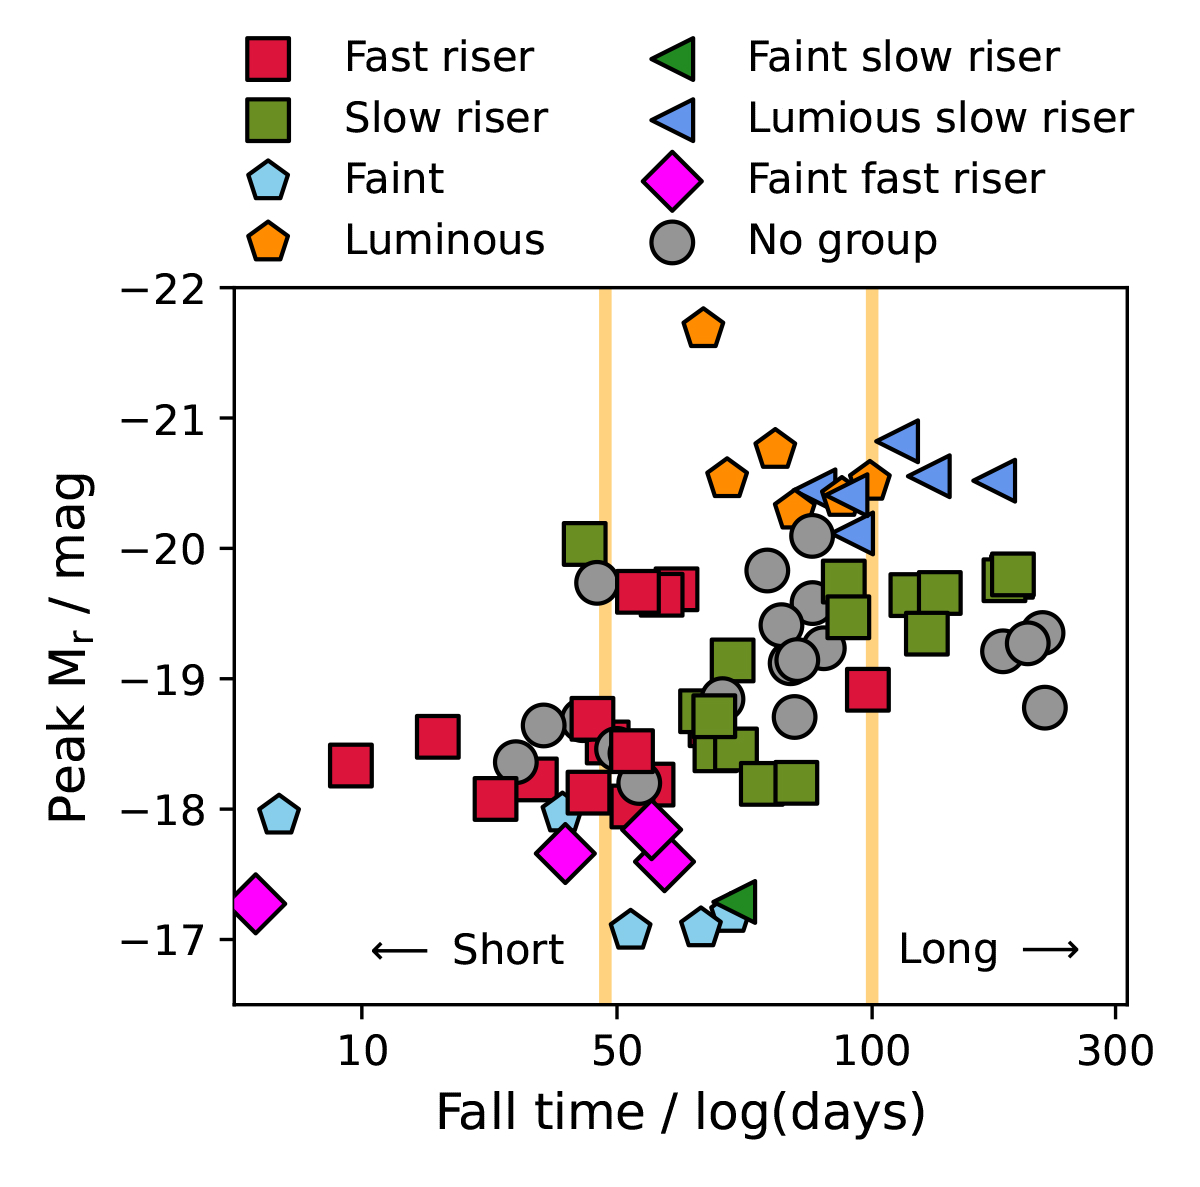
The analysis also turned up real correlations hiding in the noise. Higher CSM mass correlates with longer rise and fall times, which makes physical sense: more material means the ejecta-CSM collision lasts longer. Brighter supernovae also tend to have longer rise and fall times. These patterns aren’t statistical flukes. They’re telling us something fundamental about how these explosions work.
Why It Matters
The mass-loss rates derived from the sample are extreme. The median sits around 10⁻² solar masses per year, ranging from 10⁻⁴ to a full solar mass per year. For comparison, our sun loses about 10⁻¹⁴ solar masses per year in its relatively gentle solar wind. These progenitors were shedding material at rates millions to trillions of times higher.
That level of mass loss most closely matches the behavior of luminous blue variables (LBVs), massive, unstable stars that undergo sudden, dramatic eruptions. The most famous example is Eta Carinae, which ejected several solar masses of material in a single event in the 1840s. The paper also finds that binary star interactions likely play a role in at least some Type IIn supernovae, consistent with direct progenitor detections in the literature.
The stakes for this work are about to get much higher. The upcoming Legacy Survey of Space and Time (LSST) at the Vera C. Rubin Observatory, a powerful new telescope coming online in Chile, is expected to detect roughly 160,000 Type IIn supernovae per year. That flood of data will either confirm or overturn the trends identified here. The systematic framework Ransome and Villar built, applied to the largest archival sample yet, provides the baseline against which that torrent of new observations can be understood.
Bottom Line: By fitting 142 Type IIn supernovae with a physically motivated model, Ransome and Villar showed that these explosions trace the dramatic, irregular mass-loss events of luminous blue variables, and established population-level trends that will anchor the interpretation of tens of thousands of new detections from next-generation surveys.
IAIFI Research Highlights
This work bridges astrophysics and computational inference by applying Bayesian modeling tools to extract physical properties from a population of supernovae too diverse to interpret case-by-case, showing how systematic computational analysis can uncover structure in heterogeneous astronomical datasets.
The study puts Bayesian population-scale inference to work, fitting 142 multi-band light curves to build a statistically meaningful picture of physical parameters that no single observation could reveal.
By constraining the mass-loss histories and progenitor properties of Type IIn supernovae at population scale, this work sharpens our understanding of how massive stars end their lives and enrich the interstellar medium with heavy elements.
With LSST expected to detect ~160,000 Type IIn supernovae per year, the systematic framework developed here will be essential for interpreting the coming flood of transient data; see [arXiv:2409.10596](https://arxiv.org/abs/2409.10596) for the full analysis.